I've seen big variations in interactions of similarly interesting (to me at least) tweets that I send, and I think that a deciding factor is the day or the hour I send them. Although there's plenty of material on the web on this topic, as you will see below, personalized results can capture important factors associated with the realities of global interactions.
To get a data file containing my Twitter interactions,
- I logged into Twitter's web interface
- I went to
https://ads.twitter.com/user/YourAccountName/tweets - I clicked on the Export button on the top left to download a CSV file of my activity's data
#!/usr/bin/env Rscript
library(ggplot2)
library(plyr)

# Process command-line arguments
args <- commandArgs(trailingOnly = TRUE)
if (length(args) != 2)
  stop("usage: tweet-engangement input-file output-base-name")
input.filename <- args[1]
name <- args[2]

t <- read.csv(input.filename, header=TRUE)

# Convert time to POSIX type
t$ptime <- as.POSIXct(strptime(t$time, format="%Y-%m-%d %H:%M %z"))


# Plot tweet impressions by hour
t$hour <- strftime(t$ptime, "%H", tz="Europe/Athens")
s <- ddply(t, ~hour, summarize, mean=mean(impressions))
p <- ggplot(data=s, aes(x=hour, y=mean)) +
  geom_bar(stat="identity") +
  labs(title=paste('Impressions for', name),
    x='Local hour', y='Mean impressions')
output.filename <- paste(name, '-hour.png', sep='')
ggsave(filename=output.filename, plot=p)

# Plot tweet impressions by day of week
t$dow <- strftime(t$ptime, "%a", tz="Europe/Athens")
s <- ddply(t, ~dow, summarize, mean=mean(impressions))
p <- ggplot(data=s, aes(x=dow, y=mean)) +
  geom_bar(stat="identity") +
  labs(title=paste('Impressions for', name),
    x='Day of week', y='Mean impressions')
output.filename <- paste(name, '-dow.png', sep='')
ggsave(filename=output.filename, plot=p)
Here are the impressions per hour for three Twitter accounts I'm interested in.
@DSpinellis started out as
an account for my scientific and professional activities,
but for historical reasons has turned into an account reflecting local
(Greek) content.
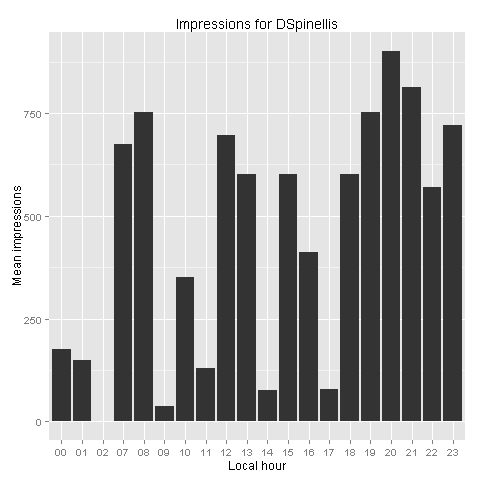
Interestingly, before I adjusted the script to deal correctly with
daylight savings time, the peak times were much less pronounced,
suggesting that the peaks are affected by our civilian time activities,
rather than those associated with astronomical time.
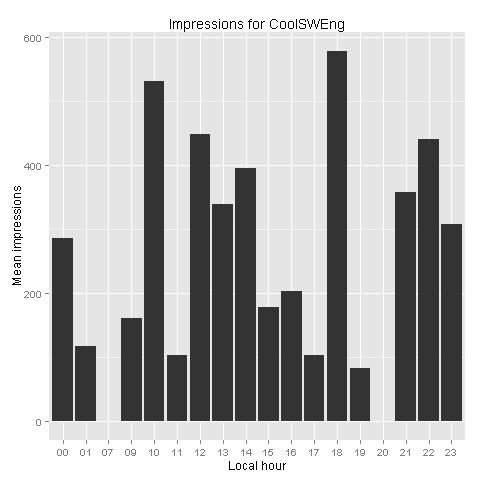
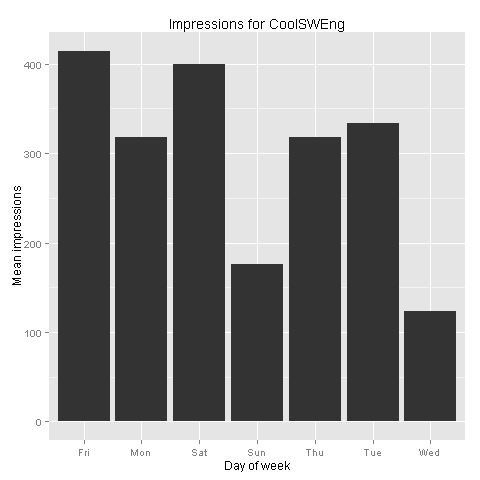
@CoolSWEng is a new account I
started for tweets regarding my scientific and professional activities,
in response to the @DSpinellis changing focus.
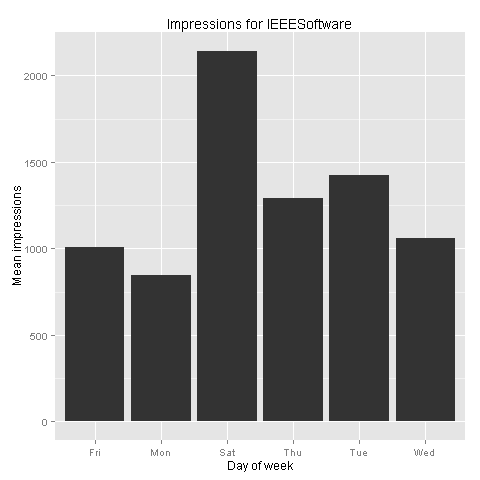
@IEEESoftware is the account
of the IEEE Software magazine,
for which, as its new Editor in Chief, I would like to see more engagement
with our community.
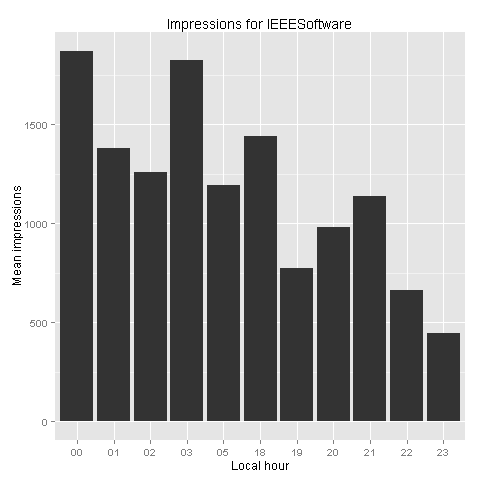
As you can see there is a two hour shift to the west between the @DSpinellis and the @CoolSWeng account, reflecting, I think, a corresponding shift of followers to colleagues living in the Central and Western European times. The IEEE Software pattern shows a restricted set of hours where tweets are posted and a more global audience.
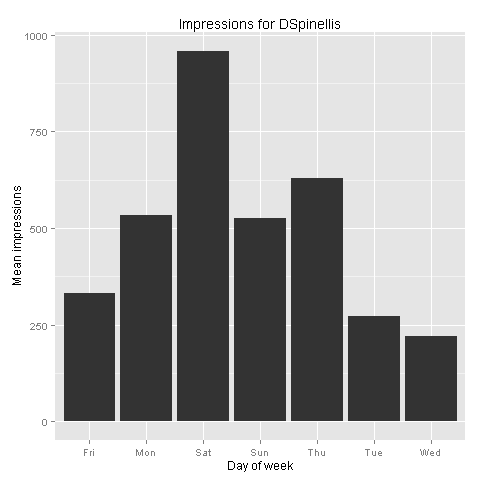
In case you're interested here are also the corresponding
day-of-week charts.


Why I Choose Email Over Messaging (2025-09-26)
Is it legal to use copyrighted works to train LLMs? (2025-06-26)
I'm removing the BSD advertising clause (2025-05-20)
The perils of GenAI student submissions (2025-04-11)
Unix make vs Apache Airflow (2024-10-15)
How (and how not) to present related work (2024-08-05)
An exception handling revelation (2024-02-05)
Extending the life of TomTom wearables (2023-09-01)
How AGI can conquer the world and what to do about it (2023-04-13)
Last modified: Wednesday, January 14, 2015 12:31 am

Unless otherwise expressly stated, all original material on this page created by Diomidis Spinellis is licensed under a Creative Commons Attribution-NonCommercial 4.0 International License.