A couple of days ago I had the privilege to see a demo of netdata by Costa Tsaousis, the person behind this project. The project offers comprehensive real time monitoring of a Linux computer with low overhead in a single easily-installed and self-contained system. I thought this was too good to be true, but the number of users and installations hinted that this could well be the case. I therefore decided to install the system on a Raspberry Pi I’m configuring to replace an ancient 20 year old IBM PS/2 server.
I installed netdata by adding writing a small Puppet module for the server’s configuration. The netdata system doesn’t currently seem to be available for Raspbian GNU/Linux, so the configuration compiled it from scratch.
class netdata {

  $netdata_packages = Package['zlib1g-dev', 'uuid-dev', 'libmnl-dev', 'gcc',
  'make', 'git', 'autoconf', 'autoconf-archive', 'autogen', 'automake',
  'pkg-config', 'curl']

  realize($netdata_packages)

  git_clone {'netdata':
    url => 'https://github.com/firehol/netdata.git',
  }

  exec {'install-netdata':
    command => '/usr/local/src/netdata/netdata-installer.sh',
    creates => '/usr/sbin/netdata',
    cwd     => '/usr/local/src/netdata',
    require => [
      Git_clone ['netdata'],
      $netdata_packages,
    ],
    logoutput => on_failure,
  }
}
Amazingly for such a sophisticated system, the installation worked almost
on the first try.
The provided installation script helpfully compiled, installed, configured,
and started netdata running as a service.
Although I find that combining all these tasks in a single command a bit
too all-inclusive for my taste, I can appreciate that this simplicity may
be part of the system’s wide appeal.
At that point I could navigate to the host’s 19999 port and explore
the detailed, readable, responsive, and beautiful interface you see
below.
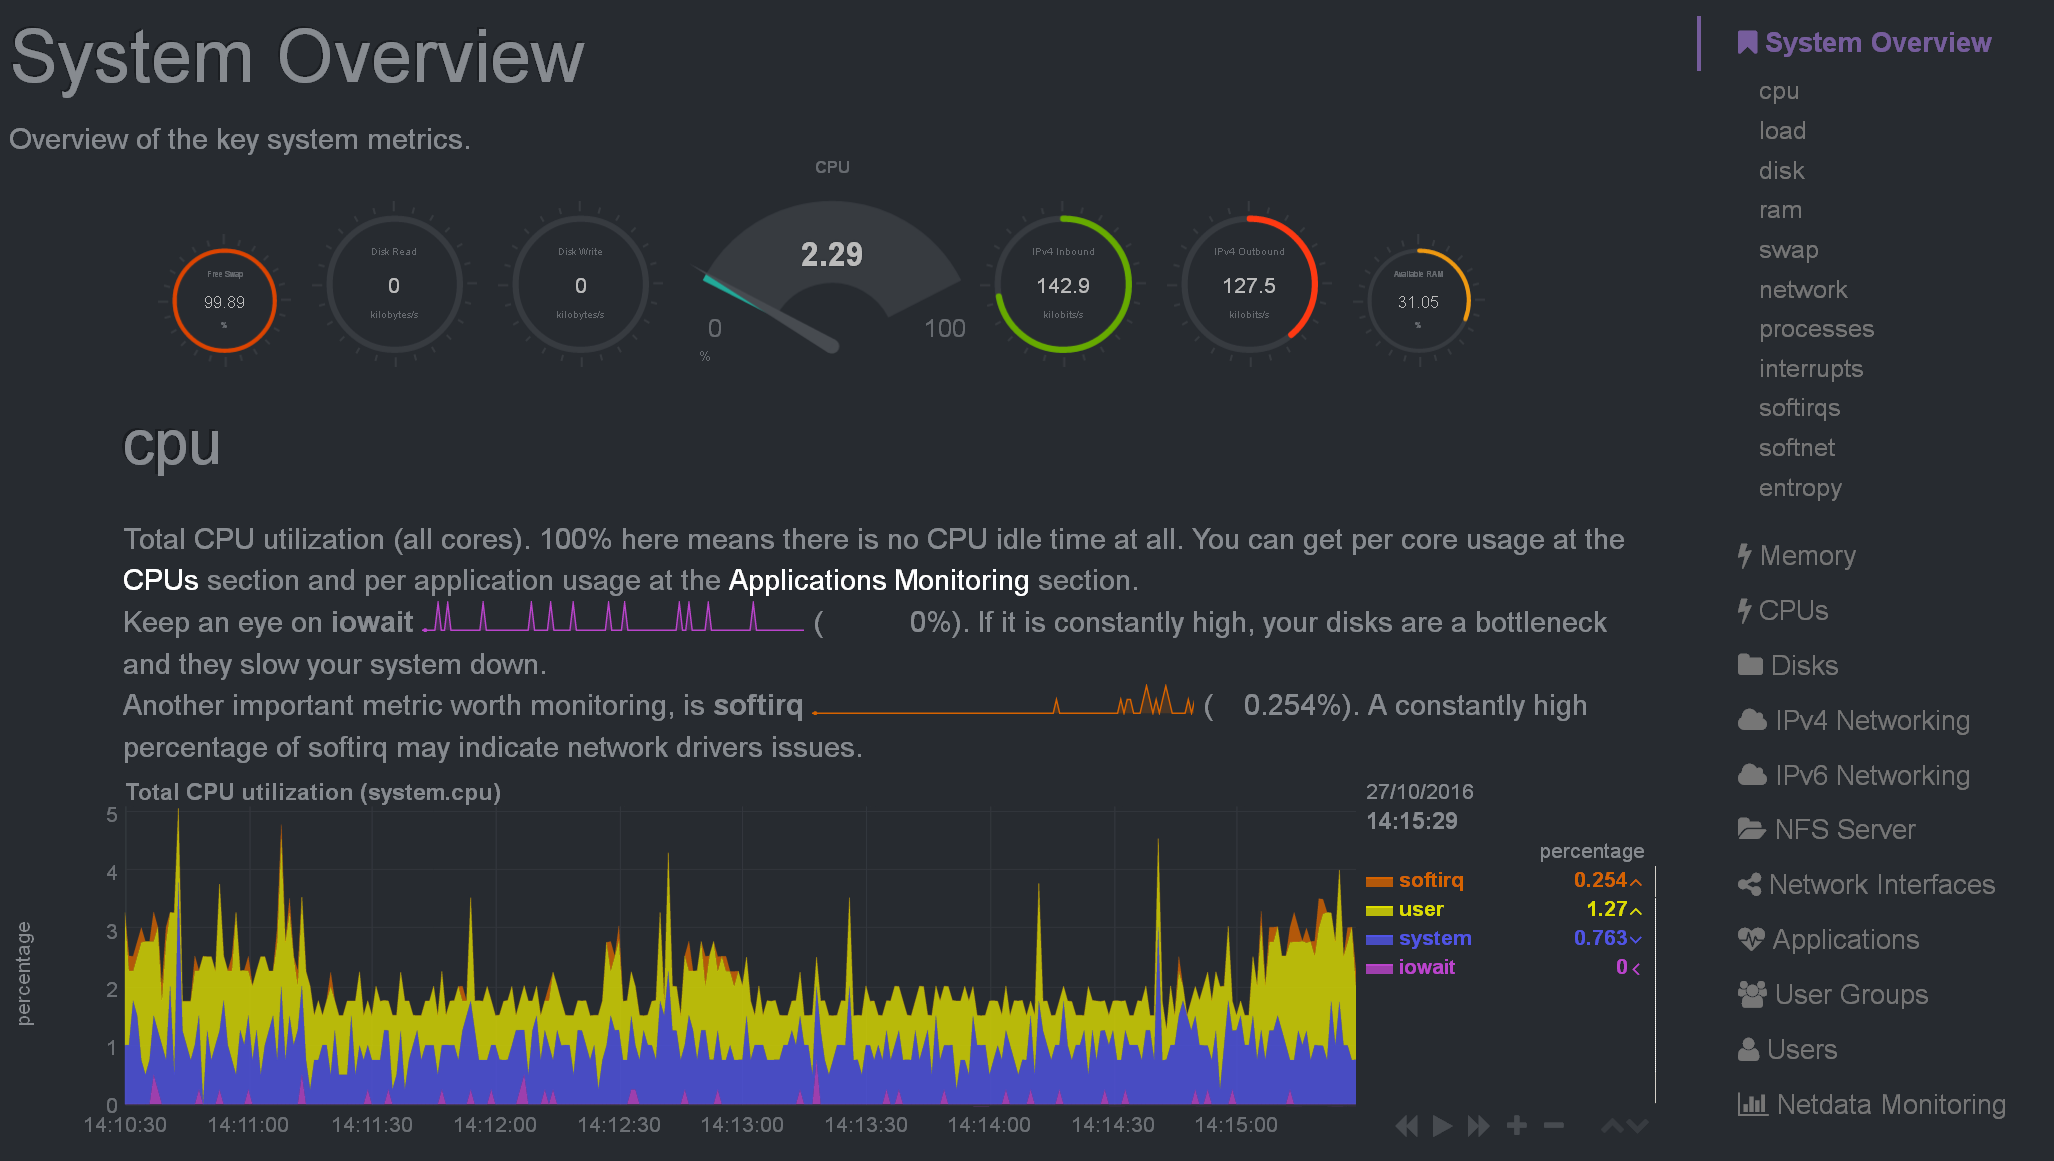
True to its promise, netdata didn’t seem to utilize more than a couple of percent of the CPU. I skimmed through the tens of pages of provided charts, and verified that data were indeed being gathered and displayed correctly from a diverse range of sources. Many charts provide helpful but concise descriptions of what they display, allowing even novices to understand them. This gentle hand-holding made me wish for some additional guidance regarding the expected ranges for some of the provided figures.
Another system I’m using for host monitoring is Nagios. Compared to it, netstat offers real-time monitoring and a much more usable and attractive display and interface, which makes Nagios’s interface look like a dinosaur. The systems also differ under the hood: Nagios is centralized, whereas netstat works in a distributed fashion, using your web browser as the central control center. The installation and configuration of netdata is much simpler than that of Nagios. On the other hand, Nagios can run on diverse systems and currently offers more plugins as well as sophisticated alarm and configuration options. I suspect that large traditional enterprises will prefer to stay with their installed Nagios systems, whereas more nimble organizations will gladly jump to the netdata bandwagon.
Comments Post Toot! Tweet


Why I Choose Email Over Messaging (2025-09-26)
Is it legal to use copyrighted works to train LLMs? (2025-06-26)
I'm removing the BSD advertising clause (2025-05-20)
The perils of GenAI student submissions (2025-04-11)
Unix make vs Apache Airflow (2024-10-15)
How (and how not) to present related work (2024-08-05)
An exception handling revelation (2024-02-05)
Extending the life of TomTom wearables (2023-09-01)
How AGI can conquer the world and what to do about it (2023-04-13)
Last modified: Thursday, October 27, 2016 3:04 pm

Unless otherwise expressly stated, all original material on this page created by Diomidis Spinellis is licensed under a Creative Commons Attribution-NonCommercial 4.0 International License.