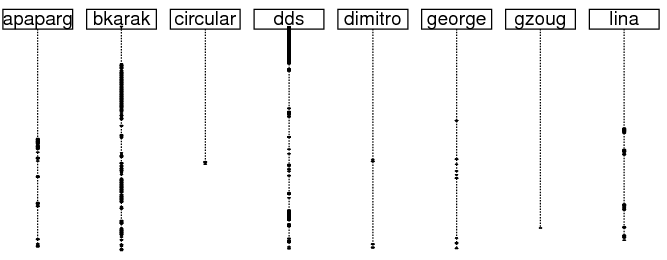
How can you visualize the developers' contributions in a collaborative project? One way involves drawing timelines adorned with marks indicating each developer's contribution. This is a simple UML sequence diagram, a diagram that allows you to see the interactions of objects, but in this case the objects are the actual developers and the interactions are their contributions.
UMLGraph allows the declarative specification of a sequence diagram. Therefore, all that is needed is a script that will convert a log from a version control system into a sequence diagram. A simple Perl script and a few calls to Unix tools will convert a CVS history log like
M 2007-02-01 16:10 +0000 akp 1.30 istlab.xml [...]
M 2007-02-26 09:11 +0000 apaparg 1.31 istlab.xml [...]
into a UMLGraph sequence diagram description with commands like
object(Clina,"lina");
object(Cmarkos,"markos");
object(Cmbina,"mbina");
object(Cpanos,"panos");
object(Ctsiaousis,"tsiaousis");
object(Cvbill,"vbill");

step();
spacing = .01;
active(Cbkarak);
step();
inactive(Cbkarak);
active(Cdds);
Then, by feeding the output into pic2plot with a command like
perl timeline.pl cvs-repository-name | pic2plot -Tpng >timeline.png
 Comments
Post
Toot!
Tweet
Comments
Post
Toot!
Tweet


Why I Choose Email Over Messaging (2025-09-26)
Is it legal to use copyrighted works to train LLMs? (2025-06-26)
I'm removing the BSD advertising clause (2025-05-20)
The perils of GenAI student submissions (2025-04-11)
Unix make vs Apache Airflow (2024-10-15)
How (and how not) to present related work (2024-08-05)
An exception handling revelation (2024-02-05)
Extending the life of TomTom wearables (2023-09-01)
How AGI can conquer the world and what to do about it (2023-04-13)
Last modified: Tuesday, February 10, 2009 11:34 am

Unless otherwise expressly stated, all original material on this page created by Diomidis Spinellis is licensed under a Creative Commons Attribution-NonCommercial 4.0 International License.