|
http://www.spinellis.gr/pubs/jrnl/2005-IEEESW-TotT/html/v26n3.html This is an HTML rendering of a working paper draft that led to a publication. The publication should always be cited in preference to this draft using the following reference:
|
1 Word = 1 Millipicture
— /usr/games/fortune
It’s no accident that in all engineering branches, our colleagues often communicate using drawings and diagrams. Given many artifacts’ scale and complexity, a drawing is often the best way to describe them. Uniquely, in software development we can easily derive pictures from code, and sometimes even code from pictures.
Yet we don’t seem to benefit from drawings in the way other engineers do. Have you ever printed a UML diagram on a large-format plotter? Perhaps part of the problem lies in the fleeting nature of software. Whereas a building’s blueprints can serve its engineers for decades, few of us want to spend valuable time drawing a diagram that will be obsolete in a few years, if not days. We can overcome these problems through tools that automate diagram creation, thus saving us time and helping us keep the diagrams up-to-date.
The text-based tools I describe can’t beat the speed of firing up your drawing editor to jot a few lines or your spreadsheet to create a chart from a list of numbers. However, once you’ve invested in learning them, you’ll be orders-of-magnitude more efficient in diagramming, performing tasks you wouldn’t dream of attempting in the GUI world.
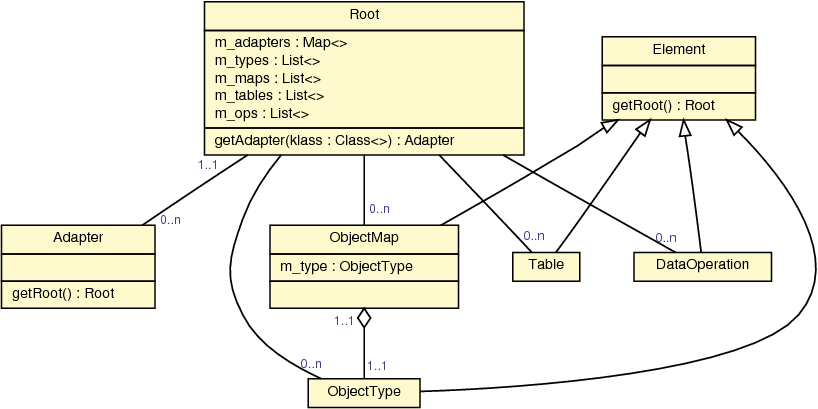
Figure 1a. Drawing by code: diagram made with dot
Perhaps the most impressive tool of the pack is dot. Part of the Graphviz suite, originally developed by AT&T, it lets you describe hierarchical relations between elements using a simple declarative language. For instance, with statements like
you’ll obtain a diagram like Figure 1a. Dot offers a wide choice of node shapes, arrows, and options for controlling the graph’s layout. It can handle graphs with thousands of nodes. I’ve used it to display class hierarchies, database schemas, directory trees, package dependency diagrams, mechanical gear connections, and even my family tree. Its input language is simple (mostly graph edges and nodes), and it’s trivial to generate a diagram from a script of just a few lines.
Three cousins of dot, also parts of GraphViz, are neato, for drawing undirected graphs, and twopi and circo, for drawing radial and circular layout graphs. All use an input language similar to dot’s. I’ve found them less useful for visualizing software systems, but in some cases they come in handy. I’ve used neato to draw the relationships between software quality attributes, links between Wikipedia nodes, and collaboration patterns between colleagues.
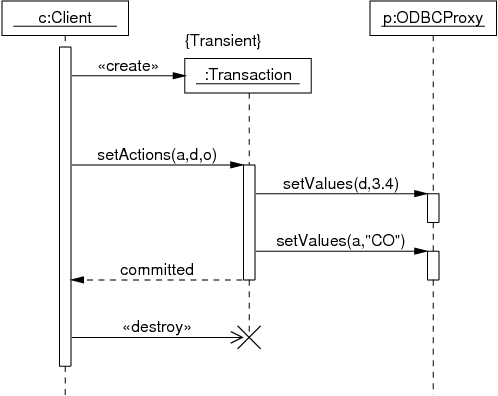
Figure 1b. Drawing by code: diagram made with pic
A slightly lower-level, but no less versatile, tool is pic. Originally developed at AT&T’s Bell Labs as part of the Unix document preparation tools, it’s more likely these days to appear in its GNU groff reincarnation. Pic’s language gives you commands such as box, circle, line, and arrow, with which you can draw diagrams like Figure 1b. Unlike the GraphViz tools, it won’t lay out the diagram for you, but it makes up for its lack of intelligence by letting you create macros and supporting loops and conditionals. This lets you define your own complex shapes (for your project’s specialized notation) and then invoke them with a simple command. In effect, you’re creating your own domain-specific drawing language.
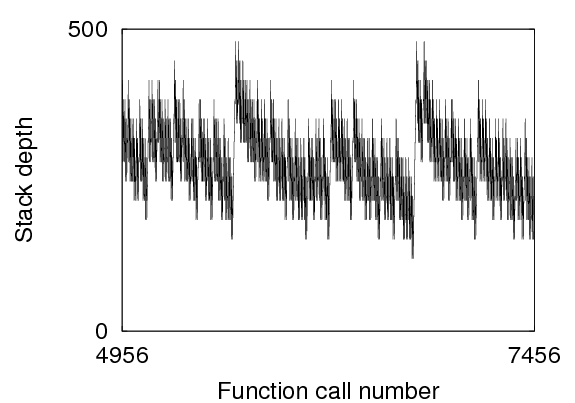
Figure 1c. Drawing by code: diagram made with gnuplot
When you’re dealing with numbers, the biggest game in town is
gnuplot. It can plot data and functions in a wide variety of 2D and 3D styles, using lines, points, boxes, contours, vector fields, surfaces, and error bars. You specify what your chart will look like with commands like “plot with points” and “set xlabel.” To plot varying data (for instance, to track the number of new and corrected bugs in your project), you typically create a canned sequence of commands that will read the data from an external file your code generates. Figure 1c depicts a program’s stack depth and was created through custom function-entry prologue code. For more-sophisticated charts—for instance, when the chart’s style varies dynamically—you can have a script create the plotting commands on the fly.
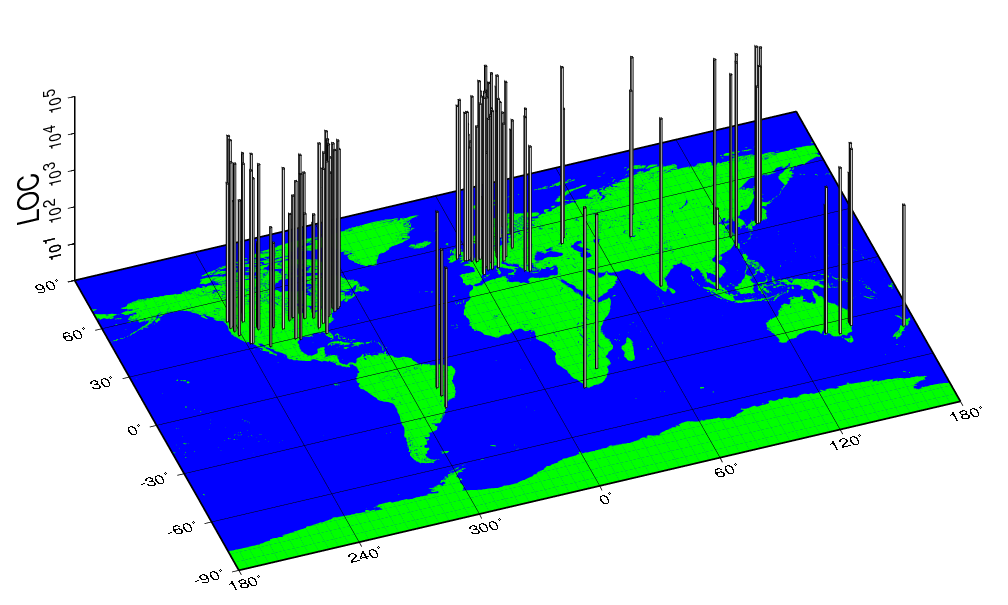
Figure 1d. Drawing by code: diagram made with GMT. Declarative tools can automate the drawing of any imaginable diagram.
The last domain I’ll cover involves geographical data. Where do your customers live? Where are your team’s most active developers? If you want to put the answers to these questions on the map, one option is the Generic Mapping Tools (GMT). You use these by plumbing together 33 tools that manipulate data and plot coastlines, grids, histograms, lines, and text using a wide range of map substrates and projections (see Figure 1d). Although these tools aren’t as easy to use as the others I’ve covered, they create high-quality output and offer extreme flexibility in a demanding domain. Another alternative involves generating KML, the Google Earth XML-based file format, which you can then readily display through Google Earth and Maps. The limited display options you get are offset by the ease of creating KML files and the resulting display’s interactivity.
At this point, I admit I’ve been a bit sneaky. I didn’t directly generate Figures 1a and 1b but used UMLGraph to drive dot and pic. Having one graphics tool or script generate output for another is a common and nifty trick. It simplifies your life by letting you reach your—sometimes daunting—goal in small increments. For instance, I once wrote a small script to scan a large C++ program and produce the Java syntax files with which UMLGraph generates class diagrams.
If none of the tools I’ve outlined fits your purpose, you can dive into lower-level graphics languages such as PostScript and SVG (Scalable Vector Graphics). I’ve used this approach to annotate program code and to illustrate memory fragmentation. Finally, you can always use ImageMagick to automate an image’s low-level manipulation.
The tools we’ve seen offer a bewildering variety of output formats. Nevertheless, the choice is easy. If you’re striving for professional-looking output, create vector-based formats such as PostScript, PDF, and SVG; choose the format your software supports best. The resulting diagrams will use nice-looking fonts and appear crisp, no matter how much you magnify them. On the other hand, bitmap formats, such as PNG, can be easier to display in a presentation, memo, or Web page. Often the best way to get a professional-looking bitmap image is to first generate it in vector form and then rasterize it through Ghostscript or a PDF viewer. Finally, if you want to polish a diagram for a one-off job, the clever route is to generate SVG and manipulate it using the Inkscape vector-graphics editor.
The tools I’ve described are distributed as free or open-source software and are available on the major operating systems. All you have to do is to install them and start automating the illustration of your software and its development process.